Q&A 32 How do you visualize hierarchical part-to-whole relationships using a treemap?
32.1 Explanation
A treemap displays hierarchical data as nested rectangles, where:
- Size represents a value (e.g., frequency or count)
- Color can encode an additional group
- Nested rectangles reflect categories and subcategories
32.2 Python Code — Interactive
import pandas as pd
import plotly.express as px

data = pd.DataFrame({
    "group": ["Setosa", "Setosa", "Versicolor", "Versicolor", "Virginica", "Virginica"],
    "subgroup": ["Short", "Long", "Short", "Long", "Short", "Long"],
    "value": [20, 30, 25, 25, 15, 35]
})

fig = px.treemap(data, path=["group", "subgroup"], values="value", color="group",
                 title="Interactive Treemap of Iris Subgroups by Plotly")
fig.show()
⚠️ Interactive treemaps using plotly.express don’t appear in PDFs. Use static alternatives for printable outputs.
32.3 Python Code — Static
For use in PDF or non-browser reports, static treemaps built with squarify are ideal.
import pandas as pd
import matplotlib.pyplot as plt
import squarify

data = pd.DataFrame({
    "label": ["Setosa Short", "Setosa Long", "Versicolor Short", "Versicolor Long", "Virginica Short", "Virginica Long"],
    "value": [20, 30, 25, 25, 15, 35]
})

colors = plt.cm.viridis_r([i / float(len(data)) for i in range(len(data))])
plt.figure(figsize=(10, 6))
squarify.plot(sizes=data["value"], label=data["label"], color=colors, alpha=0.8)
plt.axis("off")
plt.title("Static Treemap of Iris Subgroups")
plt.tight_layout()
plt.show()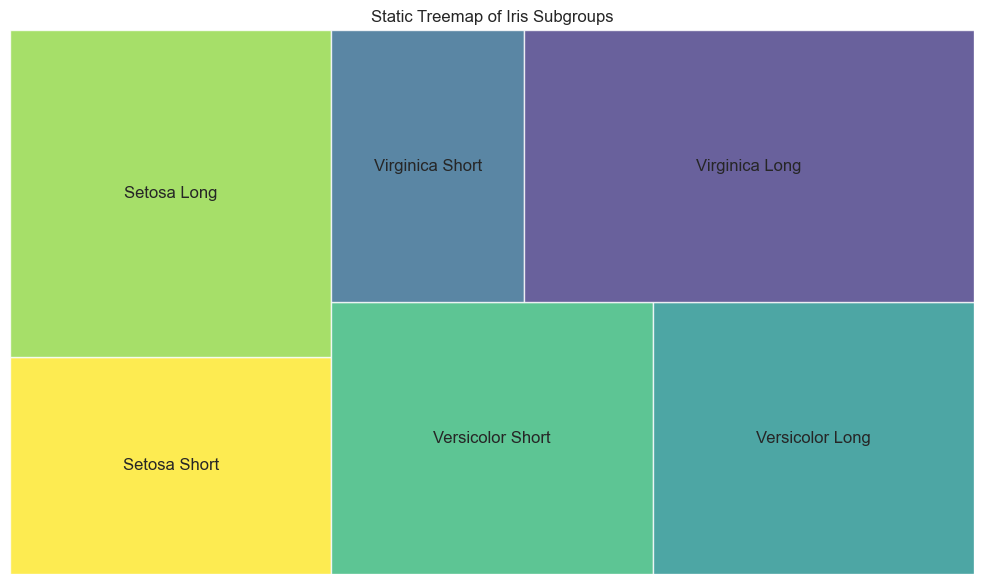
32.4 R Code
library(treemap)

data <- data.frame(
  group = c("Setosa", "Setosa", "Versicolor", "Versicolor", "Virginica", "Virginica"),
  subgroup = c("Short", "Long", "Short", "Long", "Short", "Long"),
  value = c(20, 30, 25, 25, 15, 35)
)

treemap(data, index = c("group", "subgroup"), vSize = "value",
        type = "index", title = "Treemap of Iris Subgroups")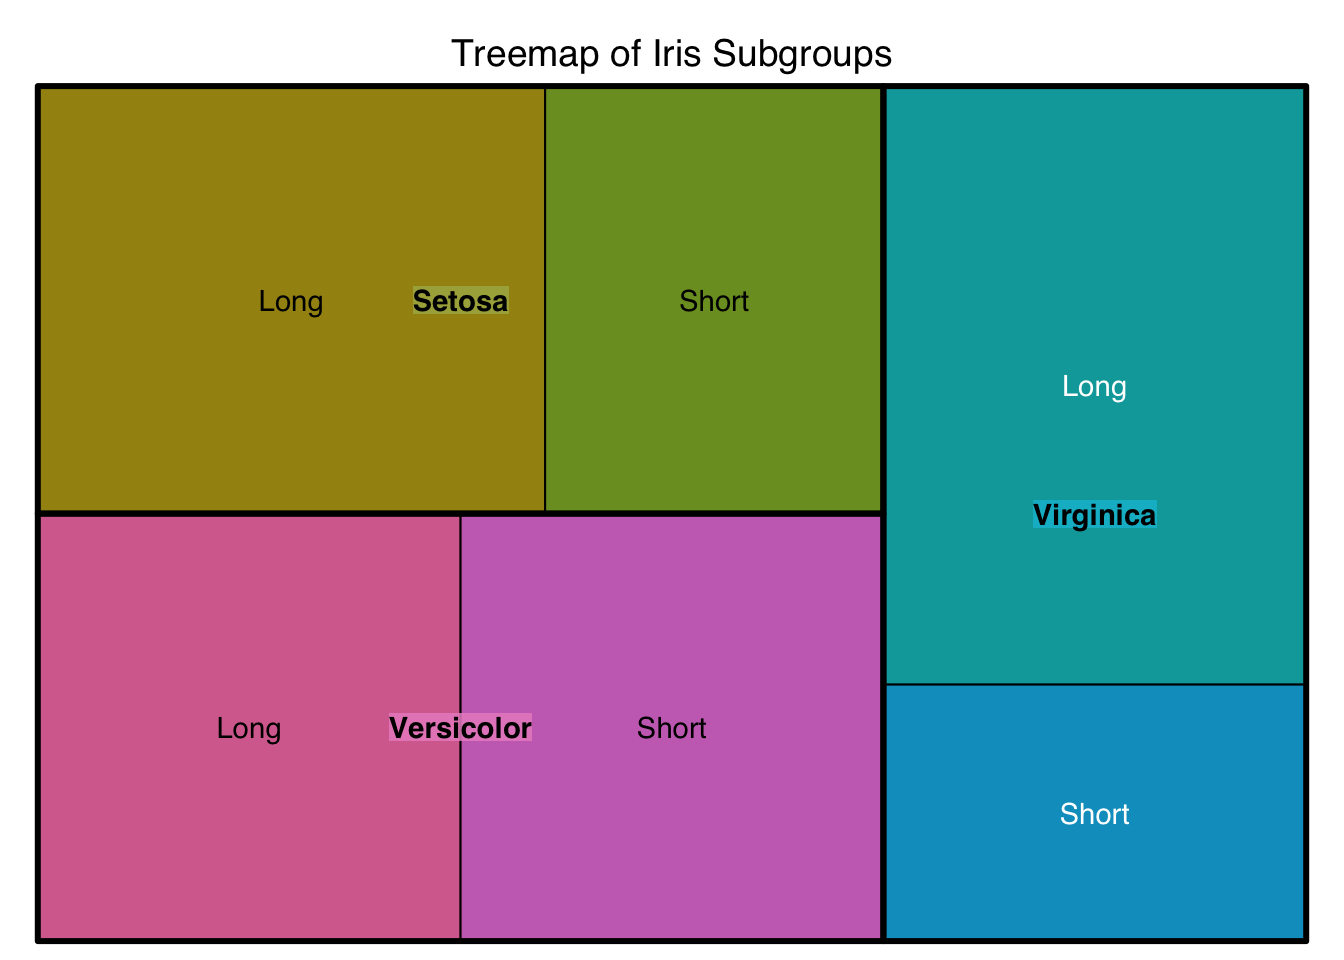
✅ Static treemaps are ideal for printed or PDF outputs and help visualize complex category structures compactly.