Q&A 11 How do you display individual data points by category using a swarm plot?
11.1 Explanation
A swarm plot displays individual data points while intelligently spacing them to avoid overlap. Unlike strip plots (which may stack points randomly), swarm plots use a repulsion algorithm to spread points for better visibility.
They are especially helpful when:
- The dataset is small to medium-sized
- You want to show raw observations
- Identifying clusters, gaps, or outliers is important
Combining swarm plots with color (hue) and category grouping enhances clarity and storytelling.
11.2 Python Code
import pandas as pd
import seaborn as sns
import matplotlib.pyplot as plt

# Load dataset
iris = pd.read_csv("data/iris.csv")

# Set style
sns.set(style="whitegrid")

# Swarm plot
plt.figure(figsize=(8, 6))
sns.swarmplot(data=iris, x="species", y="sepal_length", hue="species", palette="Set2", dodge=False, size=6)
plt.title("Swarm Plot: Sepal Length by Species", fontsize=14)
plt.xlabel("Species")
plt.ylabel("Sepal Length")
plt.tight_layout()
plt.show()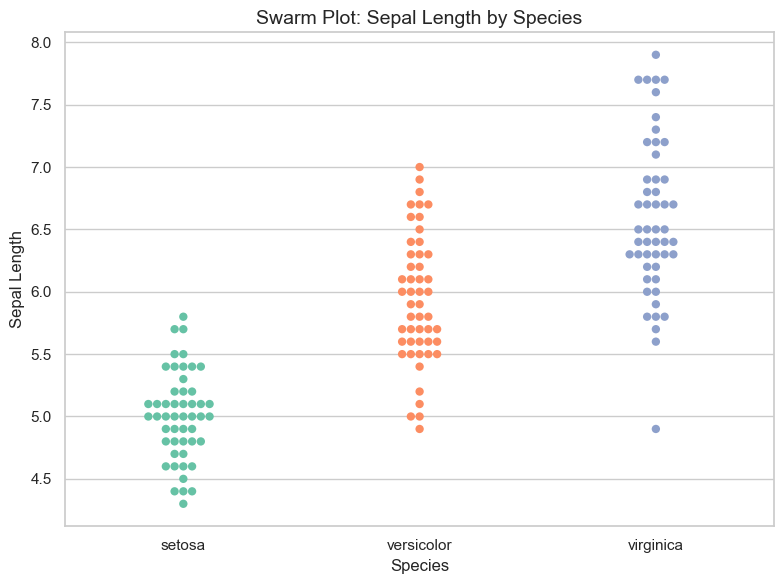
11.3 R Code
library(readr)
library(ggplot2)
library(ggbeeswarm)

# Load dataset
iris <- read_csv("data/iris.csv")

# Swarm plot using ggbeeswarm::geom_quasirandom
ggplot(iris, aes(x = species, y = sepal_length, color = species)) +
  geom_quasirandom(size = 2.5, width = 0.25) +
  scale_color_brewer(palette = "Set2") +
  theme_minimal() +
  labs(title = "Swarm Plot: Sepal Length by Species",
       x = "Species", y = "Sepal Length")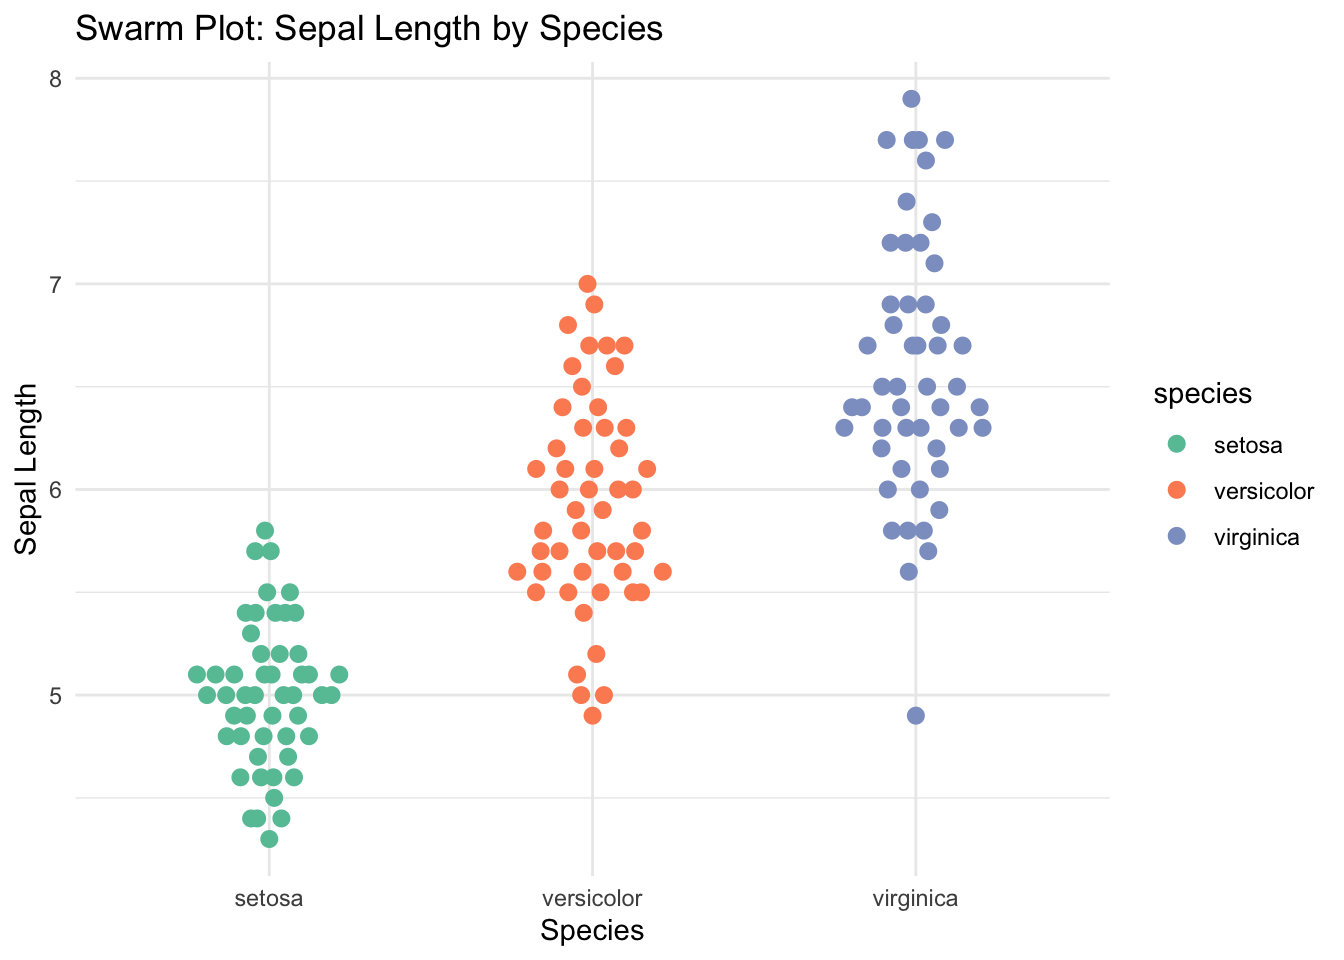
✅ Swarm plots reveal individual data points without overlap, making them ideal for exploring real observations, spotting outliers, and understanding group patterns in moderate-sized datasets.