Q&A 28 How do you visualize clustering patterns in high-dimensional data using a t-SNE plot?
28.1 Explanation
t-SNE (t-distributed Stochastic Neighbor Embedding) is a nonlinear technique that transforms high-dimensional data into 2D or 3D for visualization.
It excels at: - Revealing local clusters and grouping structures - Displaying complex, non-linear relationships - Visualizing high-dimensional feature space
t-SNE works best on pre-scaled data and is often used after initial filtering or sampling due to its high computational cost.
28.2 Python Code
import pandas as pd
from sklearn.manifold import TSNE
from sklearn.preprocessing import StandardScaler
import seaborn as sns
import matplotlib.pyplot as plt
# Load and sample data
diamonds = pd.read_csv("data/diamonds_sample.csv")
subset = diamonds[["carat", "depth", "table", "price", "x", "y", "z", "cut"]].sample(500, random_state=1)
# Standardize numeric features
X = StandardScaler().fit_transform(subset.drop("cut", axis=1))
# Apply t-SNE
tsne = TSNE(n_components=2, perplexity=30, learning_rate=200, random_state=42)
embedding = tsne.fit_transform(X)
# Prepare dataframe for plotting
tsne_df = pd.DataFrame(embedding, columns=["TSNE1", "TSNE2"])
tsne_df["cut"] = subset["cut"].values
# Plot
plt.figure(figsize=(8, 6))
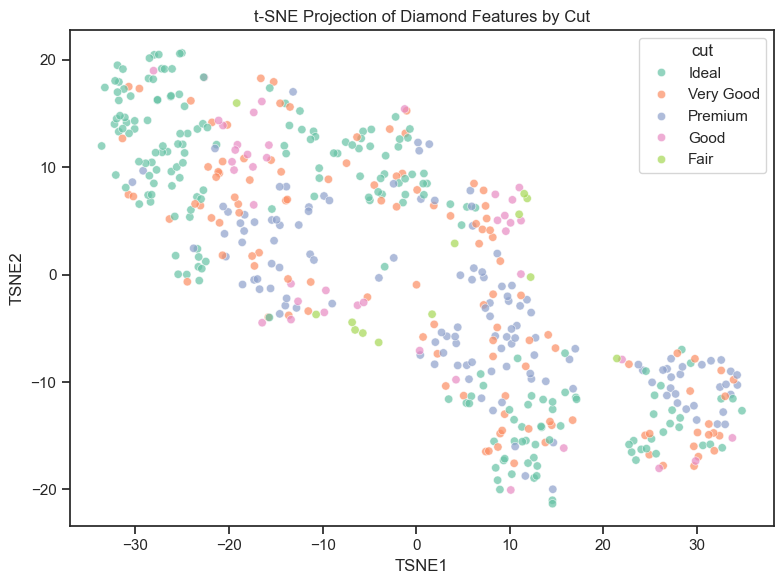
sns.scatterplot(data=tsne_df, x="TSNE1", y="TSNE2", hue="cut", palette="Set2", alpha=0.7)
plt.title("t-SNE Projection of Diamond Features by Cut")
plt.tight_layout()
plt.show()
28.3 R Code
library(readr)
library(dplyr)
library(ggplot2)
library(Rtsne)

# Load and sample
diamonds <- read_csv("data/diamonds_sample.csv")
subset <- diamonds %>% select(carat, depth, table, price, x, y, z, cut) %>% sample_n(500)

# Standardize numeric features
X <- scale(subset %>% select(-cut))

# Apply t-SNE
set.seed(42)
tsne_result <- Rtsne(X, dims = 2, perplexity = 30)

# Combine with labels
tsne_df <- data.frame(tsne_result$Y)
tsne_df$cut <- subset$cut
colnames(tsne_df) <- c("TSNE1", "TSNE2", "cut")

# Plot
ggplot(tsne_df, aes(x = TSNE1, y = TSNE2, color = cut)) +
  geom_point(alpha = 0.7) +
  scale_color_brewer(palette = "Set2") +
  theme_minimal() +
  labs(title = "t-SNE Projection of Diamond Features by Cut")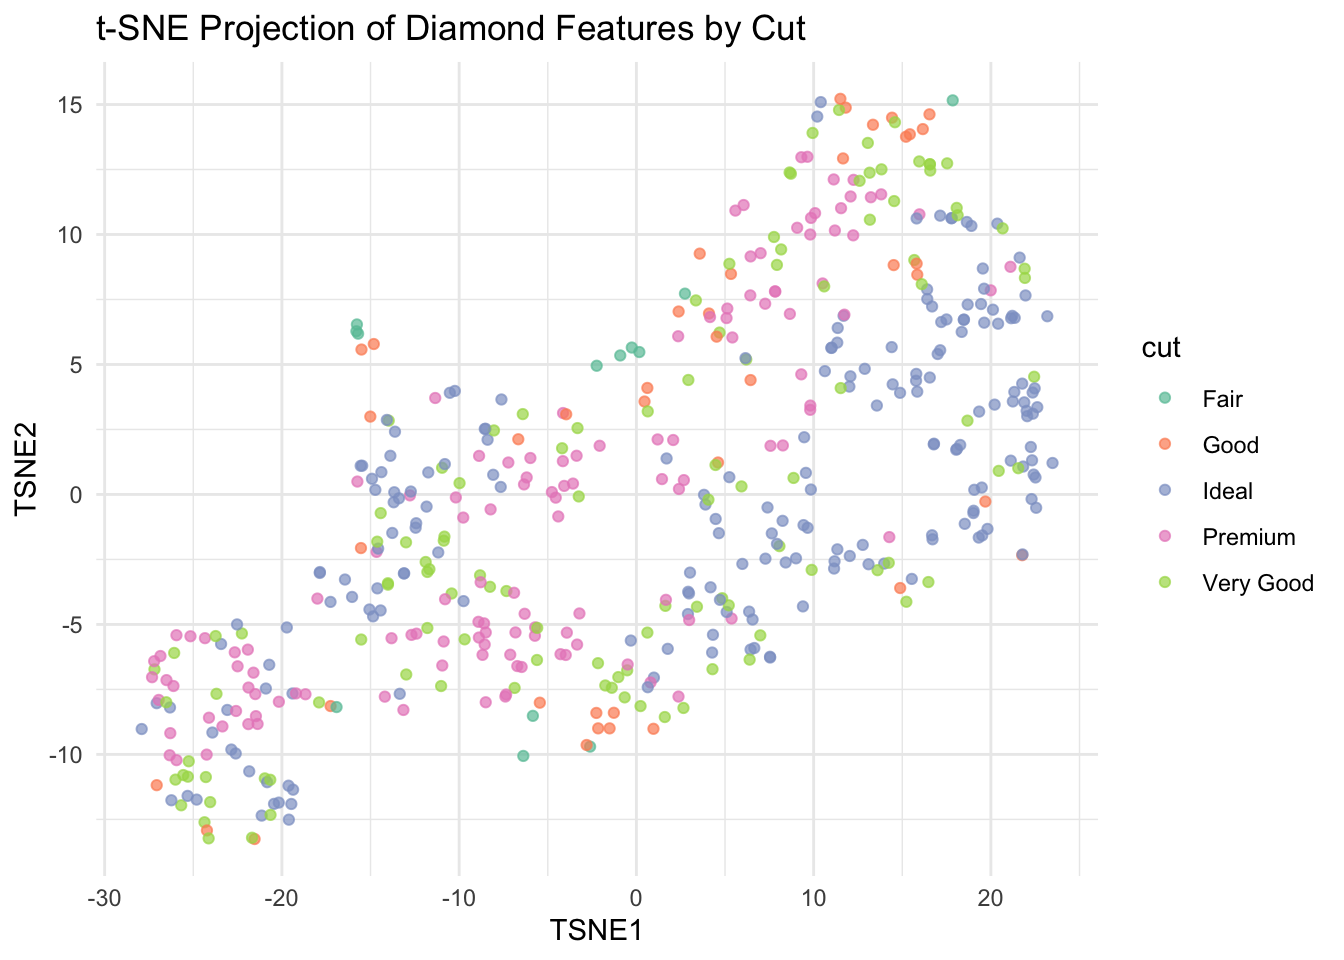
✅ t-SNE is powerful for uncovering group-level clusters in high-dimensional data. While slower than PCA or UMAP, it’s excellent for detailed structure exploration in smaller samples.